Everyday Movement Ireland Public data project · Edition 01
Movement, built into
your everyday journeys.
See how people in your area get to work or education. Then work out what a short walk could add to your own week.
CSO Census 2022 · National history 1986–2022 · Snapshot checked 2026-09-11
How does your area move?
Walking or cycling as the main means of travel. Share of the selected population, including “not stated”.
Loading interactive controls. The national findings and tables below are available without JavaScript.
Dublin City
73,091 of 260,586 people.
Not stated: 38,214 (14.7%).
Ireland · State
238,782 of 2,034,271 people.
Not stated: 163,872 (8.1%).
Dublin City is 16.3 percentage points above the State for workers aged 15+.
Pick one population, then compare places. The age groups are separate census populations—not the same people changing habits as they age. This describes journeys, not fitness. Distance, disability, caring responsibilities and safe infrastructure affect the options people have.
Dublin City work journey
Mean one-way work journey: 29.7 minutes in 2022.
2011: 27.1 min · 2016: 28.9 min · 2022: 29.7 min
Workers only · CSO F7068 · 213,998 stated durations; 46,588 not stated.
State work journey
Mean one-way work journey: 29.1 minutes in 2022.
2011: 26.6 min · 2016: 28.2 min · 2022: 29.1 min
Workers only · CSO F7068 · 1,801,317 stated durations; 232,954 not stated.
The local picture
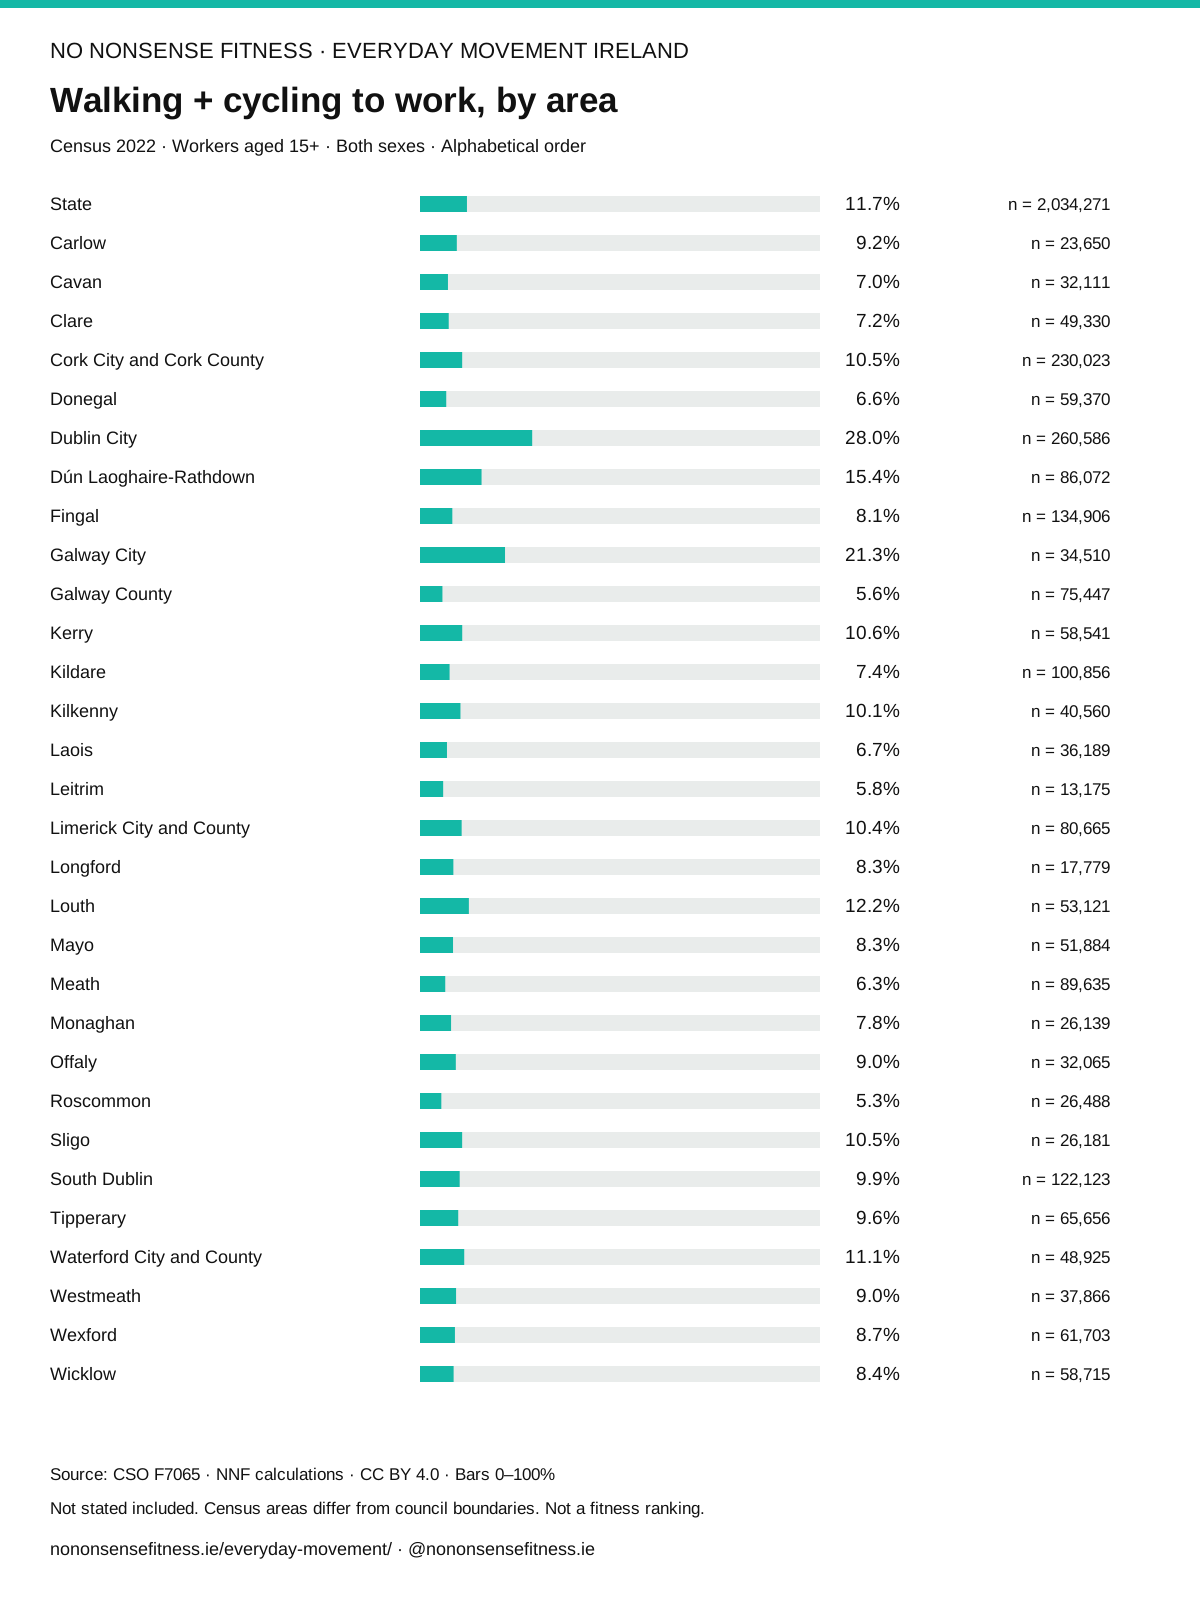
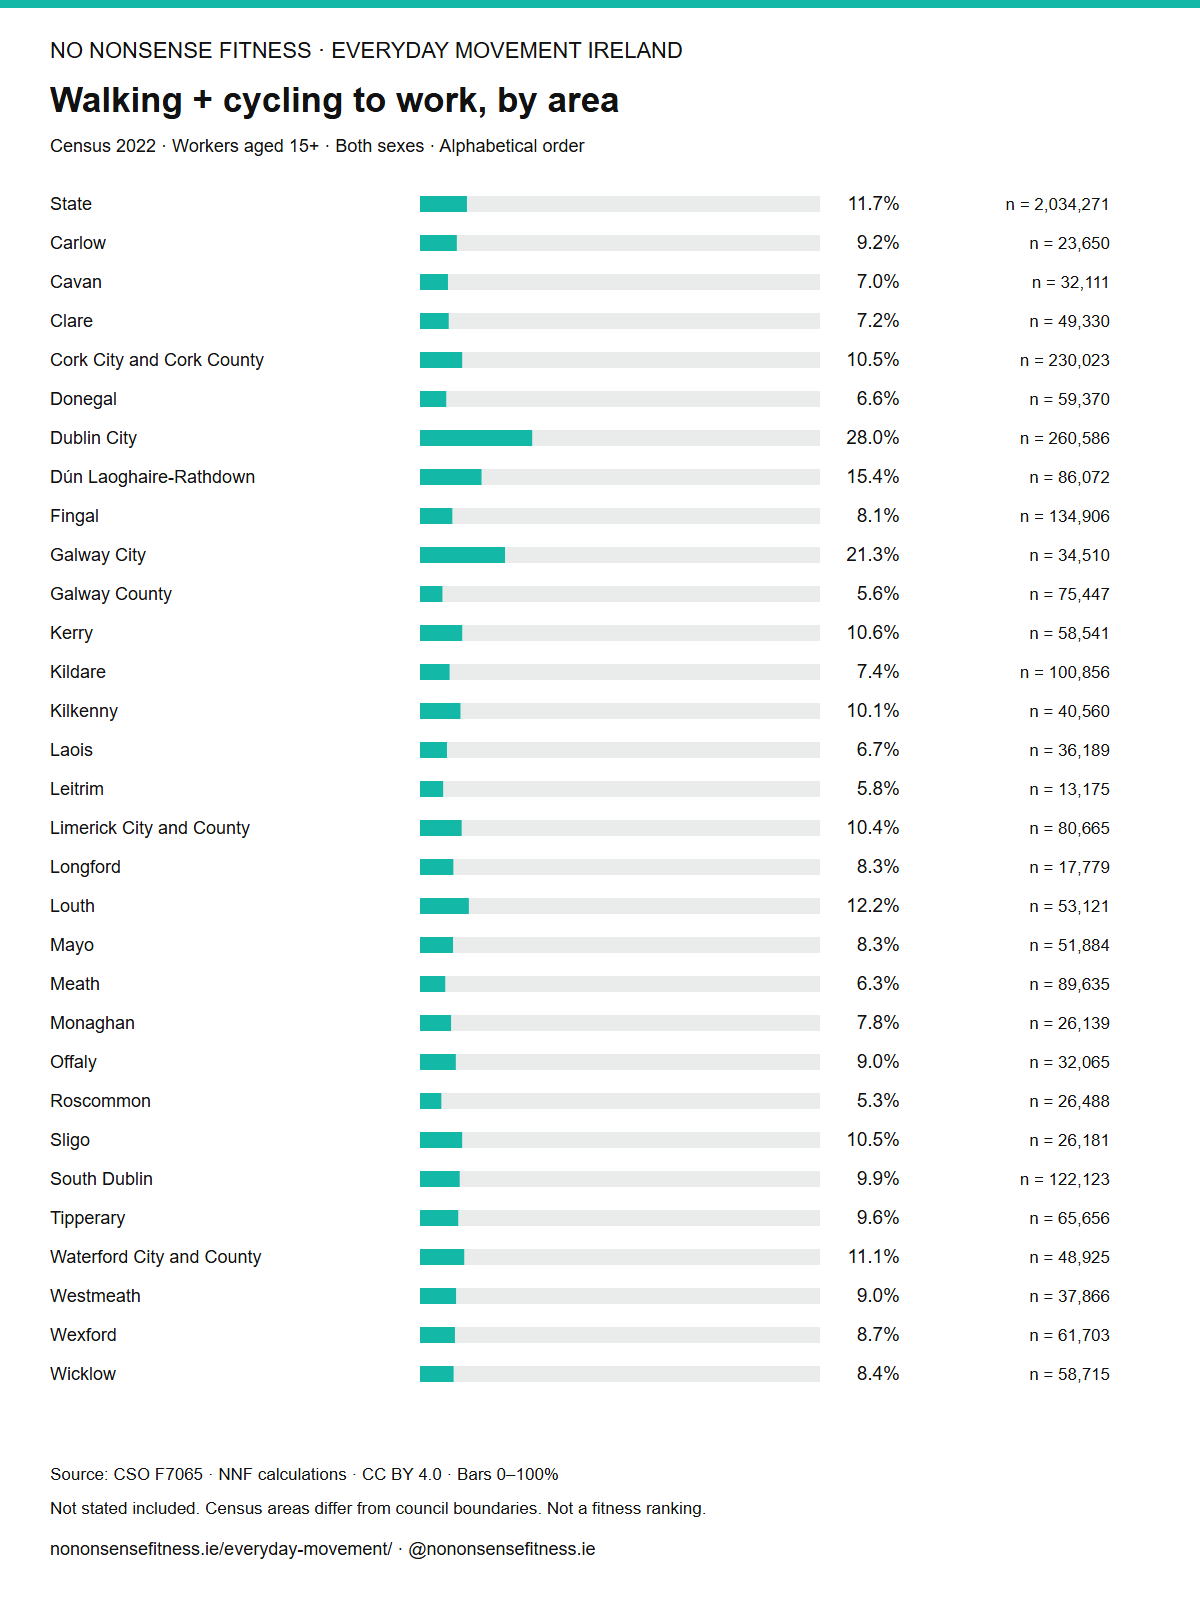
Walking + cycling share · workers aged 15+ · both sexes · 2022. Alphabetical, not a fitness ranking.
Search and compare all 30 county/city areas
| Area | Walk + cycle | On foot | Bicycle | Not stated | Total people |
|---|---|---|---|---|---|
| State | 178,111 | 60,671 | 163,872 | 2,034,271 | |
| Carlow | 1,842 | 335 | 1,908 | 23,650 | |
| Cavan | 2,075 | 169 | 2,134 | 32,111 | |
| Clare | 3,014 | 528 | 3,889 | 49,330 | |
| Cork City and Cork County | 20,752 | 3,501 | 15,787 | 230,023 | |
| Donegal | 3,596 | 299 | 3,973 | 59,370 | |
| Dublin City | 46,470 | 26,621 | 38,214 | 260,586 | |
| Dún Laoghaire-Rathdown | 6,854 | 6,390 | 3,676 | 86,072 | |
| Fingal | 7,292 | 3,611 | 10,908 | 134,906 | |
| Galway City | 5,408 | 1,927 | 4,590 | 34,510 | |
| Galway County | 3,604 | 625 | 4,742 | 75,447 | |
| Kerry | 5,303 | 876 | 4,064 | 58,541 | |
| Kildare | 6,024 | 1,436 | 5,517 | 100,856 | |
| Kilkenny | 3,537 | 565 | 2,115 | 40,560 | |
| Laois | 2,073 | 367 | 2,496 | 36,189 | |
| Leitrim | 686 | 77 | 821 | 13,175 | |
| Limerick City and County | 7,091 | 1,308 | 9,564 | 80,665 | |
| Longford | 1,246 | 237 | 2,930 | 17,779 | |
| Louth | 5,339 | 1,150 | 4,293 | 53,121 | |
| Mayo | 3,848 | 437 | 3,007 | 51,884 | |
| Meath | 5,023 | 634 | 4,269 | 89,635 | |
| Monaghan | 1,837 | 193 | 1,331 | 26,139 | |
| Offaly | 2,367 | 504 | 1,988 | 32,065 | |
| Roscommon | 1,223 | 189 | 1,732 | 26,488 | |
| Sligo | 2,400 | 359 | 2,021 | 26,181 | |
| South Dublin | 6,857 | 5,260 | 8,990 | 122,123 | |
| Tipperary | 5,704 | 571 | 4,318 | 65,656 | |
| Waterford City and County | 4,616 | 794 | 4,088 | 48,925 | |
| Westmeath | 2,897 | 518 | 3,239 | 37,866 | |
| Wexford | 4,864 | 525 | 3,794 | 61,703 | |
| Wicklow | 4,269 | 665 | 3,474 | 58,715 |
Cork City and County are combined in this source. Dublin has four areas; Galway has two. These are 30 census areas, not 31 local authorities or 26 interchangeable county totals.
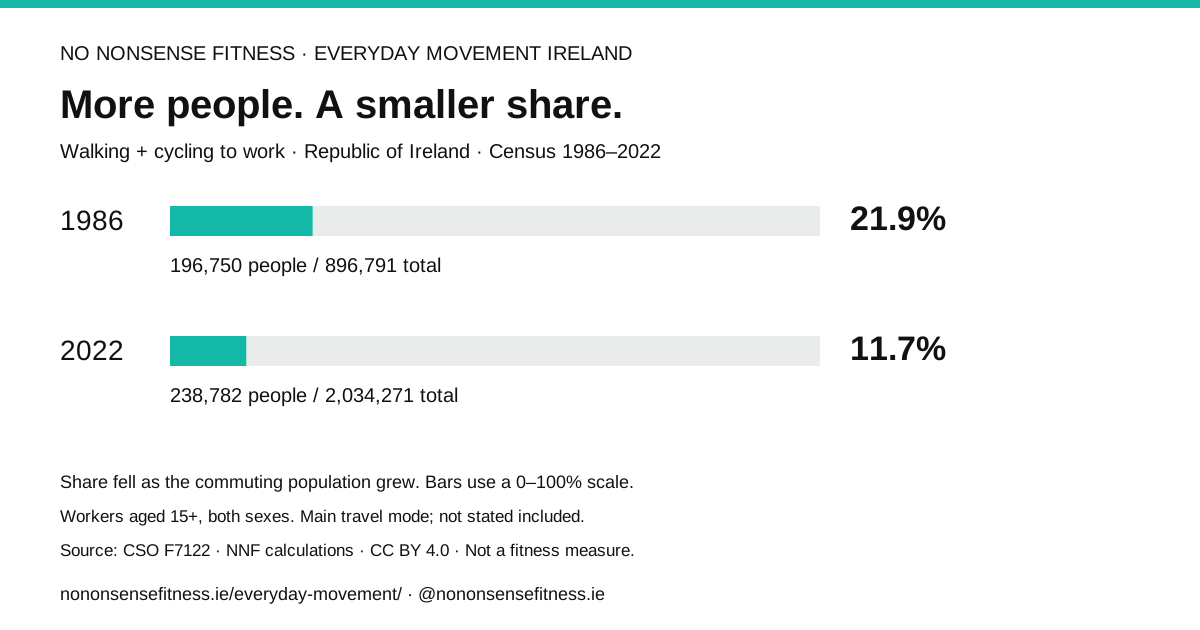
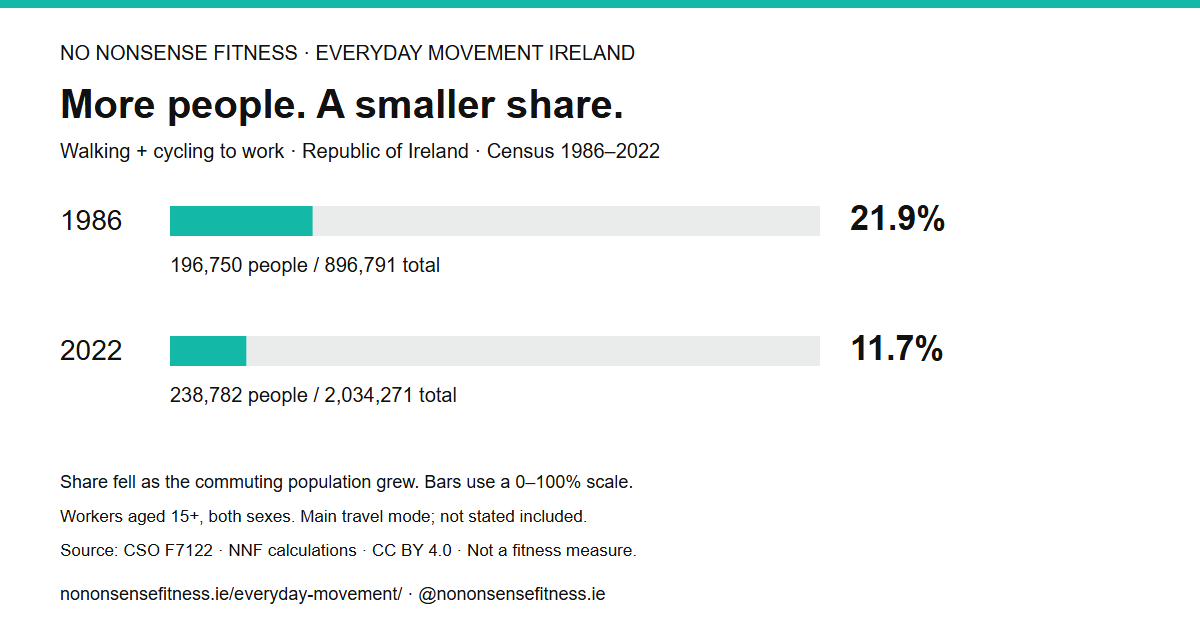
More people. A smaller share.
National walking + cycling to work: the count rose while the share fell. Choose a journey above to explore its history.
Read the national trend as a table
| Census | Walk + cycle | People | Total |
|---|---|---|---|
| 1986 | 21.9% | 196,750 | 896,791 |
| 1991 | 19.3% | 176,415 | 912,221 |
| 1996 | 17.2% | 194,808 | 1,135,261 |
| 2002 | 14.4% | 218,098 | 1,513,314 |
| 2006 | 13.5% | 241,994 | 1,787,081 |
| 2011 | 12.4% | 210,313 | 1,695,074 |
| 2016 | 12.4% | 231,917 | 1,875,773 |
| 2022 | 11.7% | 238,782 | 2,034,271 |
Each census measures a different population. Connecting points shows observations, not annual estimates. This is national history; it is not a trend for your selected county.
What could fit into your week?
A walk to a stop, part of the school run, or a lunchtime loop. Enter the walking minutes you could fit around your day.
Use walking time only. Do not enter a car journey time as if it were a walking time. Choose a route suitable for you; this tool does not assess route safety or accessibility.
Your walking time
10 minutes × 2 segments × 5 days
100 minutes is two-thirds of the 150-minute adult aerobic benchmark, if the walking is moderate intensity.
The HSE describes an adult minimum of 150 minutes of moderate aerobic activity per week. A relaxed stroll is not automatically moderate intensity. This calculator measures planned minutes, not guideline compliance or health outcomes; strength activity and other guidance are separate. Read the HSE guidance →
Find something you can use.
For actual places and routes, use Get Ireland Active. For local groups, see Get Ireland Walking. Check current access and route information with the operator before travelling.
Where the numbers come from
Built by No Nonsense Fitness from Central Statistics Office public tables. Census date: 3 April 2022. Tables published 5 December 2023; retrieved 2026-09-11. These are census observations, not a 2026 estimate of activity. Coverage is the Republic of Ireland, not Northern Ireland.
Three tables, one useful view
- F7065: main means of travel in 2022, by county/city, sex and work or education population.
- F7122: national main means of travel, census observations from 1986 to 2022.
- F7068: worker journey-time counts and published mean minutes, 2011, 2016 and 2022, by county/city and sex.
What we calculate
Walking + cycling share = (on foot + bicycle) ÷ all means of travel × 100. The denominator includes people whose mode was not stated. Differences are percentage points, calculated before rounding. We retain raw counts and display shares to one decimal place. No weights, composite scores or fitness rankings.
County comparisons use the same year, population and sex. State shares use the State counts, not an average of county percentages. The journey-time mean is the CSO’s published mean among those with a stated duration, not a mean reconstructed from time bands. We show its known-duration denominator separately.
People, boundaries and exclusions
The travel population is people usually resident and present in the State in the relevant work or education category. Workers mainly at or from home are outside this commuting population; hybrid work does not imply five commuting days. Ages 0–4 are excluded from this tool. Age bands describe the source populations, not exact school sectors. Sex labels follow the historical census categories.
Cork is combined in the published geography; we do not invent separate city counts. National history and county journey times are joined by explicit source IDs, year and sex. Comparing school pupils with workers does not measure the same people changing behaviour as they age. Urban form, distance and population mix prevent a fair “best county” league table.
Missing data and limits
“Not stated” is a response category, not zero activity. Null cells remain unavailable and zero denominators produce no percentage. The selected source snapshots contain no null cells, but they do contain substantial non-response. Main mode misses walking segments attached to bus or train journeys, recreational activity, work activity, intensity and frequency. There is no measure of route quality, gym access, total exercise, obesity or inactivity here.
Reuse and updates
Source: Central Statistics Office, Ireland. Statistical data licensed CC BY 4.0, permitting public and commercial reuse with attribution. NNF calculations and charts are adaptations, released under the same licence; no CSO endorsement implied. We use no CSO logo. CSO reuse policy.
Update cycle follows census releases and revisions. Download via the public JSON-stat API → validate dimensions and counts → join by source IDs → derive shares → generate static HTML, CSV, JSON and SVG. An editor reviews source changes before replacing this edition. A new retrieval date never turns old observations into new data.
Source register, timestamps and SHA-256 hashes · Full derived data · Pipeline source · Reproduce this edition (ZIP) · Download methodology
Raw snapshots: F7065 · F7068 · F7122. Read the CSO background notes. Corrections: contact NNF with the area, group and source cell.
For journalists and community organisations
Use the charts, check the counts, link readers to the comparison. Every finding below refers to Census 2022 unless a different census year is named.
- 238,782 workers walked or cycled as their main travel mode in 2022: 11.7% of 2,034,271 workers in the commuting population.
- The number rose from 196,750 in 1986 to 238,782 in 2022, while the share fell from 21.9% to 11.7%.
- Dublin City: 28.0% walked or cycled to work (73,091 of 260,586 people). This is Dublin City, not all Dublin.
- Among schoolchildren aged 5–12, 26.1% walked or cycled (147,066 of 563,117). This is a different population from workers.
- 163,872 workers had no stated travel mode (8.1%). They remain in the denominator.
National trend SVG · National PNG · All-area comparison SVG · All-area PNG · Media pack and headline angles
Credit: “No Nonsense Fitness analysis of CSO Census data (F7065, F7068 and F7122), CC BY 4.0.” Link to this project and retain the census year and population labels. The comparison download above creates a chart for the selected local view.