
Milbona
Creamy Natural Yogurt
Level 1
Recognised as a plain food in our food rating method.
Source record · Barcode 4056489148975
UK protein products · Open Food Facts study
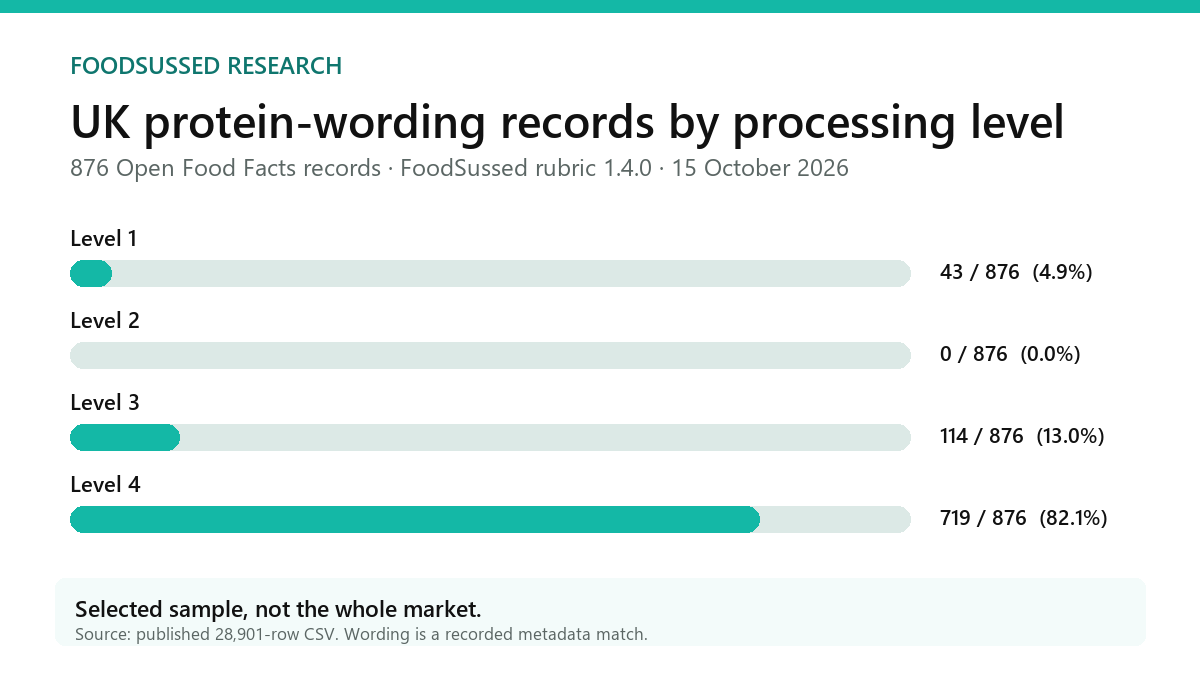
We checked 876 selected UK-listed food records with protein wording. Of these, 719 (82.1%) were Level 4: ultra-processed in our food rating method.
Check the ingredients as well as the protein label.
These are our FoodSussed ratings for a selected sample, not every product on the shelf. Level 4 doesn’t automatically make a food unhealthy.
By Keith O’Beirne · Data downloaded 15 October 2026 · No Nonsense Fitness.
Real products side by side
These examples are from this UK dataset. The names and levels are as recorded; they do not confirm what is on a UK shelf today.
Milbona
Level 1
Recognised as a plain food in our food rating method.
Source record · Barcode 4056489148975
Lindahls
Level 4
Ingredients keep the texture consistent, add sweetness with few or no calories, and add flavour.
Source record · Barcode 3023290080160
They show how our method reads different ingredient lists. They are not shopping recommendations or a comparison of nutritional quality.
Understand the ingredients
FoodSussed uses the European Commission’s approved-additive functions to explain these jobs on a label.
These names explain what an ingredient does. They are not a reason on their own to avoid a food.
The main finding
A protein bar and a tin of beans are different products. So we compared the recorded protein wording with no recorded protein wording within the same Open Food Facts main categories, then gave both groups the same category mix.
28 categories had at least five scored records in each group. After giving both groups the same category mix, the estimated difference was 5.7 percentage points (95% interval 0.3–10.8). Checks that combined likely flavour and pack-size variants also allowed no difference or a small difference in the opposite direction. Those checks covered 23 categories rather than 28. These results do not establish that UK protein products generally are more processed. These percentages give both groups the same category mix; they are not the raw percentages of products counted. Underlying matched raw counts: 283/312 (90.7%) (95% CI 87.0–93.5%) and 1,235/1,562 (79.1%) (95% CI 77.0–81.0%).
Our rules can assign Level 4 when an ingredient list contains protein isolates, protein concentrates or certain dairy fractions. The comparison therefore partly reflects how our rules classify these ingredients. It is not independent evidence that protein wording identifies poorer-quality food.
Matching used only 312/876 (35.6%) products with protein wording and 1,562/28,025 (5.6%) records without protein wording. The remaining products were in categories without at least five products in each group, or had no recorded main category. The raw, unmatched rate without recorded protein wording was 19,905/28,025 (71.0%) (95% CI 70.5–71.6%).
This describes a self-selected Open Food Facts subset accepted by our automated English-language screen, not the UK food market or purchases. Only 28,901/186,787 (15.5%) unique UK-tagged products were scored. Short English declarations may be excluded more often than long lists, potentially biasing the Level 4 share upwards. Results are not sales-weighted. FoodSussed Level 4 is an ingredient-only NOVA-informed rubric, not official NOVA or a health rating. Protein is a broad recorded name/label word proxy, not verified legal high-protein eligibility; even a negative protein phrase can match. In the product analysis, the matched estimate uses proxy n=312 and comparator n=1562 across 28 categories; only 312/876 (35.6%) proxy products enter matching. Adjusted rates are weighted estimates with these source counts, not literal case fractions. This is an association after matching OFF main category, not evidence that adding a protein claim changes processing or health.
A broad word match in recorded product names and label fields. It does not measure grams of protein, check the pack or establish legal eligibility for a high-protein claim. An ordinary food name or even a negative phrase such as “protein-free” can match. No match means no recorded match, not proof that the pack has no claim.
The wider sample
Overall, 20,624/28,901 (71.4%) (95% CI 70.8–71.9%) scored UK-tagged products met Level 4 rules. The other results were Level 1: 2,528/28,901 (8.7%) (95% CI 8.4–9.1%); Level 2: 306/28,901 (1.1%) (95% CI 0.9–1.2%); Level 3: 5,443/28,901 (18.8%) (95% CI 18.4–19.3%).
This describes a self-selected Open Food Facts subset accepted by our automated English-language screen, not the UK food market or purchases. Only 28,901/186,787 (15.5%) unique UK-tagged products were scored. Short English declarations may be excluded more often than long lists, potentially biasing the Level 4 share upwards. Results are not sales-weighted. FoodSussed Level 4 is an ingredient-only NOVA-informed rubric, not official NOVA or a health rating.
These are the largest qualifying OFF main categories, not supermarket aisles. Other products sit in narrower categories or have no recorded main category. The table includes products both with and without protein wording. On a phone, scroll the table sideways.
| OFF main category | Level 1 | Level 2 | Level 3 | Level 4 |
|---|---|---|---|---|
| Groceries | 44/553 (8.0%) 95% CI 6.0–10.5% | 6/553 (1.1%) 95% CI 0.5–2.3% | 150/553 (27.1%) 95% CI 23.6–31.0% | 353/553 (63.8%) 95% CI 59.7–67.7% |
| Sweets | 0/320 (0.0%) 95% CI 0.0–1.2% | 3/320 (0.9%) 95% CI 0.3–2.7% | 1/320 (0.3%) 95% CI 0.1–1.7% | 316/320 (98.8%) 95% CI 96.8–99.5% |
| Biscuits | 6/274 (2.2%) 95% CI 1.0–4.7% | 0/274 (0.0%) 95% CI 0.0–1.4% | 61/274 (22.3%) 95% CI 17.7–27.6% | 207/274 (75.5%) 95% CI 70.1–80.3% |
| Potato crisps | 1/238 (0.4%) 95% CI 0.1–2.3% | 0/238 (0.0%) 95% CI 0.0–1.6% | 26/238 (10.9%) 95% CI 7.6–15.5% | 211/238 (88.7%) 95% CI 84.0–92.1% |
| Breads | 5/227 (2.2%) 95% CI 0.9–5.1% | 0/227 (0.0%) 95% CI 0.0–1.7% | 80/227 (35.2%) 95% CI 29.3–41.7% | 142/227 (62.6%) 95% CI 56.1–68.6% |
| Crisps | 0/227 (0.0%) 95% CI 0.0–1.7% | 0/227 (0.0%) 95% CI 0.0–1.7% | 23/227 (10.1%) 95% CI 6.8–14.7% | 204/227 (89.9%) 95% CI 85.3–93.2% |
| Microwave meals | 3/198 (1.5%) 95% CI 0.5–4.4% | 0/198 (0.0%) 95% CI 0.0–1.9% | 61/198 (30.8%) 95% CI 24.8–37.6% | 134/198 (67.7%) 95% CI 60.9–73.8% |
| Mueslis | 10/159 (6.3%) 95% CI 3.5–11.2% | 0/159 (0.0%) 95% CI 0.0–2.4% | 45/159 (28.3%) 95% CI 21.9–35.8% | 104/159 (65.4%) 95% CI 57.7–72.4% |
| Sweetened beverages | 2/149 (1.3%) 95% CI 0.4–4.8% | 0/149 (0.0%) 95% CI 0.0–2.5% | 9/149 (6.0%) 95% CI 3.2–11.1% | 138/149 (92.6%) 95% CI 87.3–95.8% |
| Snacks | 1/134 (0.7%) 95% CI 0.1–4.1% | 0/134 (0.0%) 95% CI 0.0–2.8% | 29/134 (21.6%) 95% CI 15.5–29.4% | 104/134 (77.6%) 95% CI 69.8–83.8% |
| Yoghurts | 12/133 (9.0%) 95% CI 5.2–15.1% | 0/133 (0.0%) 95% CI 0.0–2.8% | 5/133 (3.8%) 95% CI 1.6–8.5% | 116/133 (87.2%) 95% CI 80.5–91.9% |
| Crackers and savoury appetisers | 0/131 (0.0%) 95% CI 0.0–2.8% | 0/131 (0.0%) 95% CI 0.0–2.8% | 42/131 (32.1%) 95% CI 24.7–40.5% | 89/131 (67.9%) 95% CI 59.5–75.3% |
| Hummus | 1/127 (0.8%) 95% CI 0.1–4.3% | 0/127 (0.0%) 95% CI 0.0–2.9% | 107/127 (84.3%) 95% CI 76.9–89.6% | 19/127 (15.0%) 95% CI 9.8–22.2% |
| Pizzas | 0/127 (0.0%) 95% CI 0.0–2.9% | 0/127 (0.0%) 95% CI 0.0–2.9% | 40/127 (31.5%) 95% CI 24.1–40.0% | 87/127 (68.5%) 95% CI 60.0–75.9% |
| Soups | 2/125 (1.6%) 95% CI 0.4–5.6% | 0/125 (0.0%) 95% CI 0.0–3.0% | 42/125 (33.6%) 95% CI 25.9–42.3% | 81/125 (64.8%) 95% CI 56.1–72.6% |
| Meat analogues | 2/112 (1.8%) 95% CI 0.5–6.3% | 0/112 (0.0%) 95% CI 0.0–3.3% | 4/112 (3.6%) 95% CI 1.4–8.8% | 106/112 (94.6%) 95% CI 88.8–97.5% |
| Cakes | 1/103 (1.0%) 95% CI 0.2–5.3% | 0/103 (0.0%) 95% CI 0.0–3.6% | 8/103 (7.8%) 95% CI 4.0–14.6% | 94/103 (91.3%) 95% CI 84.2–95.3% |
| Chocolates | 0/99 (0.0%) 95% CI 0.0–3.7% | 0/99 (0.0%) 95% CI 0.0–3.7% | 6/99 (6.1%) 95% CI 2.8–12.6% | 93/99 (93.9%) 95% CI 87.4–97.2% |
| Sauces | 0/97 (0.0%) 95% CI 0.0–3.8% | 0/97 (0.0%) 95% CI 0.0–3.8% | 21/97 (21.6%) 95% CI 14.6–30.8% | 76/97 (78.4%) 95% CI 69.2–85.4% |
| Breakfast cereals | 4/94 (4.3%) 95% CI 1.7–10.4% | 0/94 (0.0%) 95% CI 0.0–3.9% | 24/94 (25.5%) 95% CI 17.8–35.2% | 66/94 (70.2%) 95% CI 60.3–78.5% |
| Cereal bars | 1/91 (1.1%) 95% CI 0.2–6.0% | 0/91 (0.0%) 95% CI 0.0–4.1% | 16/91 (17.6%) 95% CI 11.1–26.7% | 74/91 (81.3%) 95% CI 72.1–88.0% |
| Chickens | 6/86 (7.0%) 95% CI 3.2–14.4% | 0/86 (0.0%) 95% CI 0.0–4.3% | 7/86 (8.1%) 95% CI 4.0–15.9% | 73/86 (84.9%) 95% CI 75.8–90.9% |
| Confectioneries | 4/83 (4.8%) 95% CI 1.9–11.7% | 1/83 (1.2%) 95% CI 0.2–6.5% | 0/83 (0.0%) 95% CI 0.0–4.4% | 78/83 (94.0%) 95% CI 86.7–97.4% |
| Protein bars | 1/82 (1.2%) 95% CI 0.2–6.6% | 0/82 (0.0%) 95% CI 0.0–4.5% | 2/82 (2.4%) 95% CI 0.7–8.5% | 79/82 (96.3%) 95% CI 89.8–98.7% |
| Ice creams | 1/81 (1.2%) 95% CI 0.2–6.7% | 0/81 (0.0%) 95% CI 0.0–4.5% | 5/81 (6.2%) 95% CI 2.7–13.6% | 75/81 (92.6%) 95% CI 84.8–96.6% |
Display names use UK English; the CSV retains the original Open Food Facts category identifiers.
Among yoghurt records with protein wording, the results differed between Open Food Facts categories. In “yoghurts”, records with protein wording were Level 4 in 15/17 (88.2%) (95% CI 65.7–96.7%) cases versus 101/116 (87.1%) (95% CI 79.8–92.0%) without recorded protein wording. In “Greek-style yoghurts”, it was 3/10 (30.0%) (95% CI 10.8–60.3%) versus 28/64 (43.8%) (95% CI 32.3–55.9%). A single protein label cannot settle the processing question.
Checking the finding
We repeated the pre-declared analysis after excluding old records, combining approximate flavour and pack-size families, and doing both. The point estimates remain similar within the admitted subset, but both family-view difference intervals include zero. These checks do not remove the selection bias.
| View | Overall Level 4 n/N | Protein Level 4 n/N | Adjusted protein wording | Adjusted other | Difference (pp) | Source n; categories |
|---|---|---|---|---|---|---|
| Products: all dates | 20,624/28,901 (71.4%) 95% CI 70.8–71.9% | 719/876 (82.1%) 95% CI 79.4–84.5% | 86.0% 95% CI 80.9–90.8% | 80.4% 95% CI 78.5–82.2% | 5.7 pp 95% CI 0.3–10.8 pp | 312 / 1,562; 28 |
| Products: excluding old | 20,109/28,217 (71.3%) 95% CI 70.7–71.8% | 712/867 (82.1%) 95% CI 79.4–84.5% | 86.0% 95% CI 80.9–90.7% | 80.1% 95% CI 78.2–81.9% | 5.8 pp 95% CI 0.4–10.9 pp | 310 / 1,541; 28 |
| Likely product variants combined, all dates | 19,730/27,696 (71.2%) 95% CI 70.7–71.8% | 677/827 (81.9%) 95% CI 79.1–84.3% | 85.4% 95% CI 79.7–90.5% | 80.3% 95% CI 78.3–82.3% | 5.1 pp 95% CI -0.8–10.6 pp | 273 / 1,317; 23 |
| Likely product variants combined, after excluding older records | 19,230/27,030 (71.1%) 95% CI 70.6–71.7% | 670/818 (81.9%) 95% CI 79.1–84.4% | 85.3% 95% CI 79.7–90.5% | 80.1% 95% CI 78.0–82.1% | 5.3 pp 95% CI -0.7–10.8 pp | 271 / 1,298; 23 |
“Old” means last edited before 15 October 2024. A database edit is not a recipe check. Family collapse picks the newest representative using a fixed name/brand rule; it can miss variants or combine different products. Excluding old records happens before selecting fresh family representatives.
Method and limits
In our scored UK-tagged Open Food Facts subset, 719/876 (82.1%) (95% CI 79.4–84.5%) products with protein wording met FoodSussed Level 4 rules. We searched recorded product names and label fields for protein wording. We did not verify front-of-pack claims, protein content or eligibility for a high-protein claim.
That is a finding about selected database records. It is not a verdict on protein, a health score or a picture of the whole UK food market.
By Keith O’Beirne · 15 October 2026 · No Nonsense Fitness. Source: Open Food Facts.
95% CI 79.4–84.5%
FoodSussed’s ingredient-only estimate, not an expert NOVA assessment or health rating. Only 15.5% of UK-tagged records were scored. Excluding short ingredient lists may inflate the Level 4 share. Products were not weighted by sales.
Disclosure: this analysis was produced by No Nonsense Fitness, which makes FoodSussed, the app promoted below. It describes outputs from our own classification rules and does not independently validate them against expert NOVA assessments or establish health effects.
Level 4 is FoodSussed’s estimate of ultra-processing from the ingredient list. It is NOVA-informed, not official NOVA or a health rating.
We downloaded Open Food Facts’ contributor-built export on 15 October 2026. Ingredient lists, names and categories may be incomplete, incorrect or outdated. A recent download or database edit does not verify the current recipe or availability in UK shops. We selected exact UK country tags, resolved duplicate barcodes and scored ingredient declarations with the unchanged FoodSussed processing rubric 1.4.0.
These ranges show statistical uncertainty under our stated assumptions. The records were not randomly sampled from UK shops, so the ranges do not cover selection bias or errors in the records or our classifications. Raw proportions use Wilson score intervals. Matched rates and their difference use a stratified percentile bootstrap: 10,000 resamples within each fixed category and protein-wording group, retaining group sizes and the observed pooled category weights (seed 20261015). Binary outcomes are resampled as binomial counts, equivalent to sampling products with replacement within each group. Some category groups are small and contain only one observed outcome. Resampling gives those groups no variation, which may understate uncertainty. The intervals also assume independent records within each group; related recipes and brands may weaken that assumption. Treat the narrow exclusion of zero cautiously. These intervals are conditional on the observed categories and do not cover uncertainty in language admission, family grouping or processing classification.
Open Food Facts is contributor-built and self-selected. Of 186,787 unique UK-tagged products, 62,745/186,787 (33.6%) had nonempty ingredient text and 28,901/186,787 (15.5%) were scored. Missing, incomplete, very short, OCR-damaged, non-English, uncertain-language and unclear declarations remained unscored.
The export did not supply a verified English declaration field. We used the rubric gates plus the locked additional screen: offline Lingua 2.2.0 English relative confidence at least 0.80, or a frozen exact English plain-food term. Confidence is not a calibrated probability. This subset was accepted by our automated English-language screen, not independently human-verified English. Short lists may be rejected more often, potentially biasing Level 4 upwards.
Each supported named main category needed at least five units in each arm. Both arms were weighted to the same pooled category distribution across 28 categories (protein-wording n=312; comparator n=1,562). Category identifiers were fixed before scoring. Categories can be inconsistent, overly specific or missing: 6,164/28,901 (21.3%) scored products had no main category. Matching does not make products equivalent or control brand, price, recipe age, nutrients or consumption. There were no significance tests or causal estimates.
FoodSussed Level 4 is an ingredient-only NOVA-informed rubric, not official NOVA, a health rating or a safety assessment. It estimates processing from declared ingredients and cannot inspect manufacturing. No health outcomes were measured. Nutrition, portion size, convenience and the rest of someone’s diet are separate questions. This page gives no product-avoidance advice.
The NHS explanation of processed foods also distinguishes processing from nutritional quality. For our worked ingredient examples and Level definitions, see how processed is your food? That separate Irish selected basket uses a different population and should not be pooled with this UK OFF study.
If you shop in Tesco, Sainsbury’s, Asda, Morrisons, Aldi, Lidl, M&S, Waitrose, Co-op or Iceland, check the current pack. A UK country tag does not prove current availability at any retailer. We have omitted the own-brand table from this first version: narrow brand matches, missing exclusive sub-brands and different category mixes cannot rank supermarket healthiness.
Products are not weighted by sales, purchases or consumption. Record modification dates can be stale and do not verify recipes. Approximate flavour/size families can split or overmerge products; mixed families remain a limitation.
Check the numbers
This CSV lets you recount the published Levels and main category comparison. It does not contain ingredient declarations, record dates, family assignments or excluded records, so it cannot by itself reproduce the classifications, selection process or all sensitivity analyses.
The CSV contains all 28,901 scored barcode records, including 876 with the broad protein wording match. It includes barcode, name, brand, OFF main category, recorded protein wording flag, Level and reasons. Import barcodes as text to preserve leading zeros.
Source: Open Food Facts, downloaded 15 October 2026. OFF-derived database shared under ODbL 1.0; individual contents under the Database Contents Licence. Retain attribution and follow the applicable share-alike terms when reusing the database. No pack images are redistributed.
FoodSussed · Coming soon to Google Play
This study looks at recorded UK product data. FoodSussed brings the check to the ingredient list in your hand, with your food diary alongside it.
Planned UK pricing: £8.99/month or £69.99/year. Ireland: €9.99/month or €79.95/year.
7-day free trial for eligible new subscribers. Renews unless cancelled. The Android app is not on Google Play yet.
For barcode information, try FoodSussed.
Straight answers
In this UK-tagged Open Food Facts subset, 79/82 (96.3%) (95% CI 89.8–98.7%) products in the protein-bars main category met FoodSussed Level 4 rules. That category includes products without a recorded protein word match. The result describes the scored sample, not every UK protein bar. Check the ingredients on the pack; a processing estimate is not a health rating.
A high-protein name alone cannot tell you. In the OFF yoghurts main category, products with protein wording were Level 4 in 15/17 (88.2%) (95% CI 65.7–96.7%) cases, compared with 101/116 (87.1%) (95% CI 79.8–92.0%) without recorded protein wording. In the separate Greek-style yoghurts category, the figures were 3/10 (30.0%) (95% CI 10.8–60.3%) and 28/64 (43.8%) (95% CI 32.3–55.9%). These are small, selected category samples, not UK yoghurt market estimates.
This study cannot show that. The category-matched estimates were 86.0% for products with protein wording (source n=312) and 80.4% without recorded protein wording (source n=1,562), across 28 OFF main categories. Matching category does not control recipe, brand, nutrients or consumption. This is an association, not causation. After giving both groups the same category mix, the estimated difference was 5.7 percentage points (95% interval 0.3–10.8). Checks that combined likely flavour and pack-size variants also allowed no difference or a small difference in the opposite direction. Those checks covered 23 categories rather than 28. These results do not establish that UK protein products generally are more processed. Our rules can assign Level 4 when an ingredient list contains protein isolates, protein concentrates or certain dairy fractions. The comparison therefore partly reflects how our rules classify these ingredients. It is not independent evidence that protein wording identifies poorer-quality food.
No. UK-tagged records are not a complete shelf survey of Tesco, Sainsbury’s, Asda, Aldi, Lidl or other retailers. Category mixes and contributor coverage differ. We have left supermarket own-brand percentages out of this page. Processing is not healthiness.
No. FoodSussed Level 4 is an ingredient-only NOVA-informed rubric estimate. This study used version 1.4.0, not official NOVA classifications. It does not measure health outcomes, food safety or the quality of someone’s diet.
General education. No clinical, dietary or health conclusions follow from these database comparisons. Processing estimates depend on the recorded declarations.
More of our research, including the separate Christmas and January food processing study.